Financial stability
06
Analysis of financial and economic indicators
GRI 2-6
Analysis of actual income and expenses in 2024, million tenge
| 2024 Plan | 2024 Actual | Deviation | The main causes of deviations | |
|---|---|---|---|---|
| Consolidated income | 312,043.1 | 338,447 | 108% | |
| Income from core business | 304,358.7 | 319,905.9 | 105% |
1. The growth of revenues from regulated services by 7,706.2 million tenge, including:
3. The growth of income from financial transactions on VDS in the amount of 5,406.6 million tenge. |
| Consolidated expenses | 254,773.2 | 264,582.5 | 104% | |
| Cost price | 217,533.5 | 228,253.9 | 105% |
1. An increase in the cost of technological consumption of electricity by 8,968.8 million tenge as a result of an increase in actual volumes by 102.5 million kWh (by 1,643.9 million tenge) and an increase in the average price to 18.43 tenge/kWh (plan 16.03 tenge/kWh) by 7,324.8 million tenge;
2. An increase in the cost of purchasing electricity in order to compensate for hourly deviations in the actual interstate balance of electricity flows by 10,001.2 million tenge; 3. Reduction of the cost of capacity regulation provided by third-party organizations by KZT 3,670.1 million. |
| General and administrative expenses | 14,173.8 | 11,219.5 | 79% | The decrease occurred as a result of the restoration of the accounts receivable reserve (Rosseti PJSC) and the resulting savings on current costs. |
| Implementation expenses | 623 | 548.6 | 88% | Reduction as a result of the current savings on current expenses |
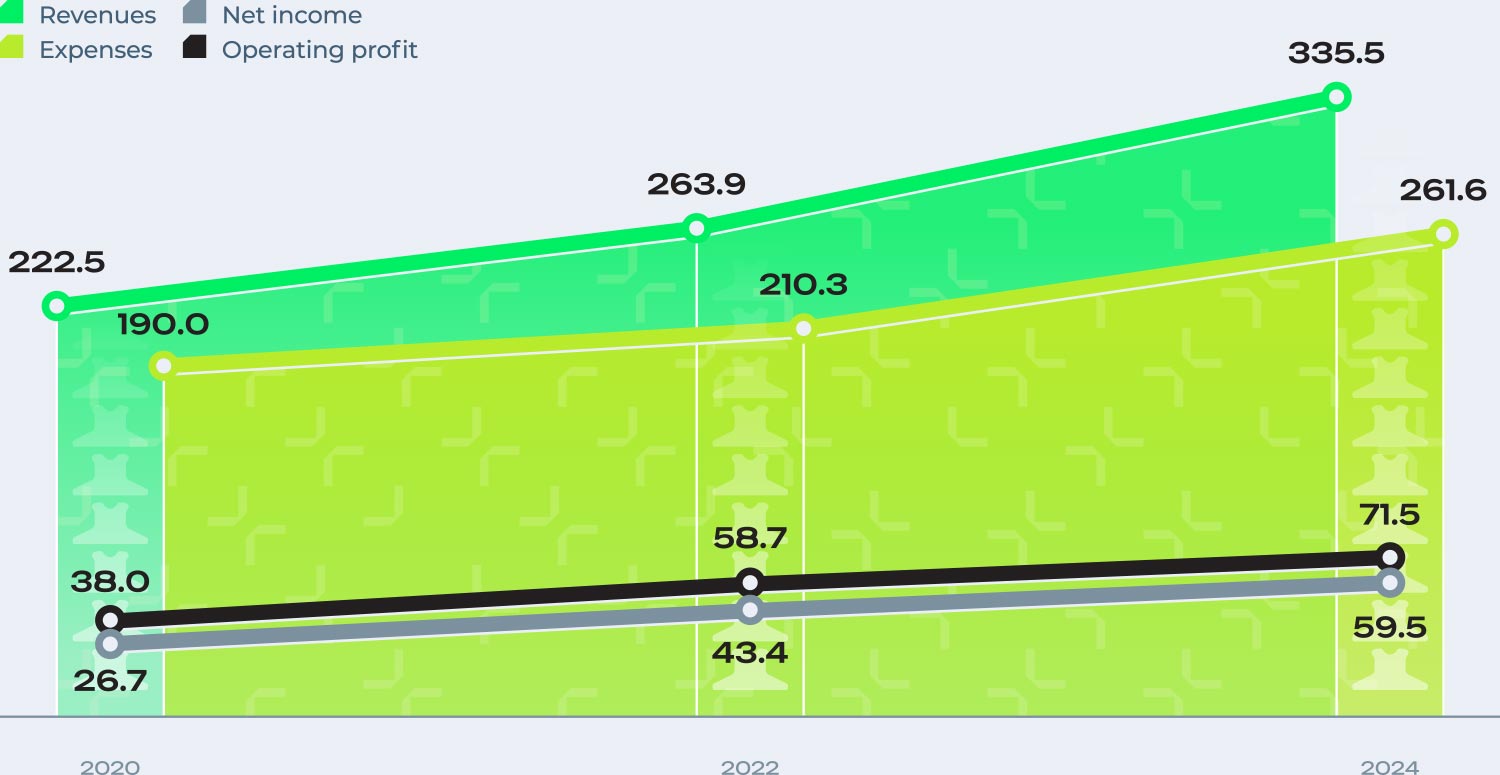
| Operating profit | 72,028.3 | 79,883.9 | 111% |
Analysis of the actual indicators of income and expenses in 2024 with the actual indicators in 2023, million tenge
| 2023 Actual | 2024 Actual | Deviation | The main causes of deviations | |
|---|---|---|---|---|
| Consolidated income | 266,496.2 | 338,447 | 127% | |
| Income from core business | 252,136.3 | 319,905.9 | 127% |
The increase was mainly due to an increase in revenues from regulated services by 44,010.9 million tenge as a result of changes in tariffs and volumes of services provided and the commissioning of services for the use of the NPG from July 1, 2023.
At the same time, compared to the same period last year, revenues from the sale of electric energy in the framework of the balancing market of the Republic of Kazakhstan increased by 23,121.2 million tenge. |
| Consolidated expenses | 212,897.5 | 264,582.5 | 124% | |
| Cost price | 181,403.6 | 228,253.9 | 126% | Compared to the same period in 2023, cost expenses increased by 46,850.3 million tenge, which was mainly due to an increase in the cost of purchasing balancing electric energy by 9,282.0 million tenge, technological electricity consumption by 23,595.7 million tenge, maintenance of capacity reserves by 1,708.3 million tenge, expenses for purchase of electricity in order to compensate for imbalances by 4,742.3 million tenge, as well as the wage fund by 4,295.6 million tenge as a result of systematic measures to improve the level of social stability. |
| General and administrative expenses | 13,680.3 | 11,219.5 | 82% | The decrease resulted from the restoration of the accounts receivable reserve |
| Implementation expenses | 490.9 | 548.6 | 112% | The increase is due to an increase in the wage fund |
| Operating profit | 56,561 | 79,883.9 | 141% |
Dynamics of financial and economic indicators, billion tenge
Coefficient analysis
23.366
billion tenge
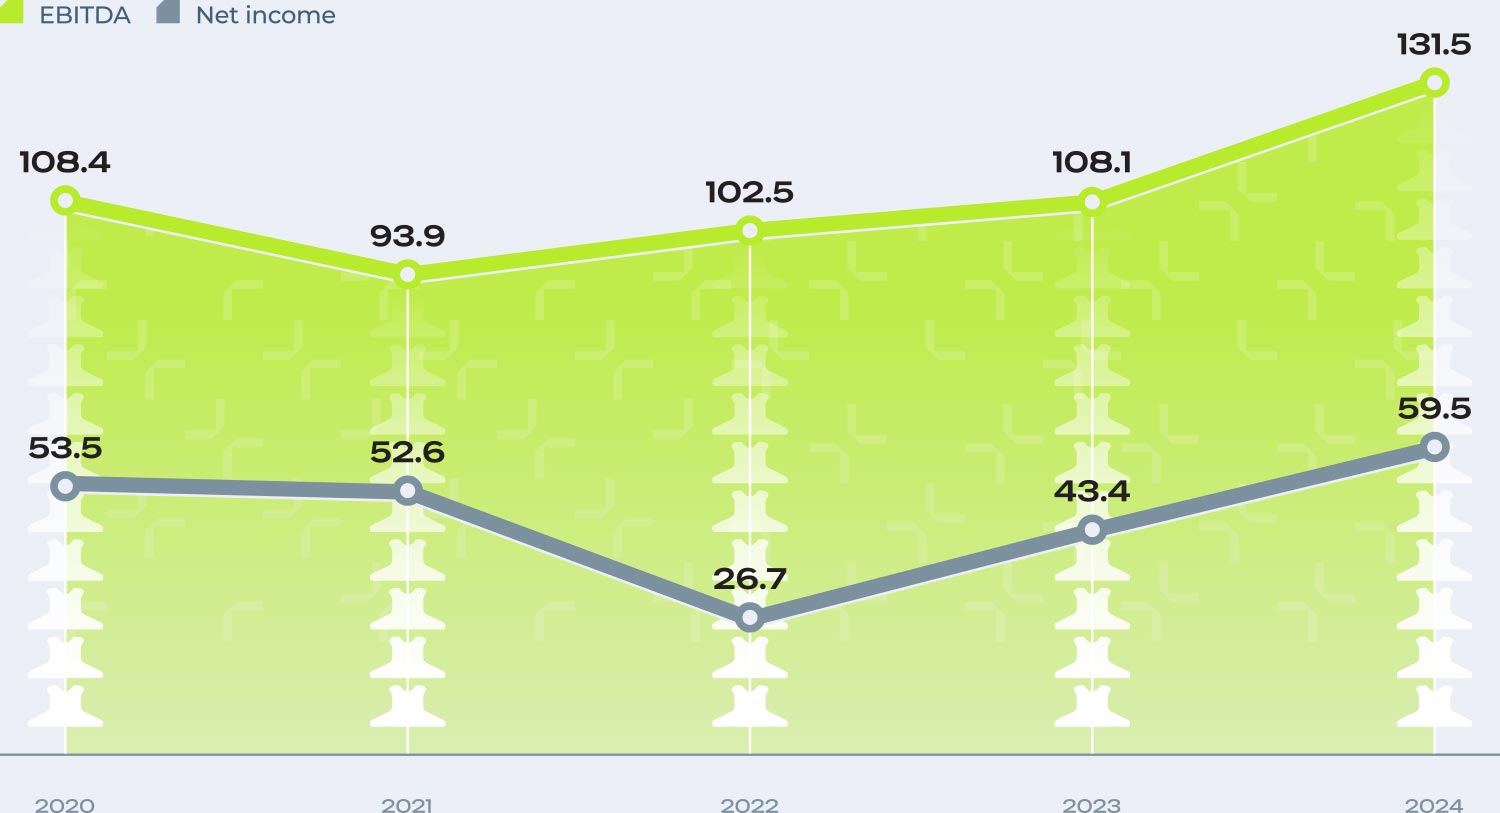
Increase in EBITDA in 2024 compared to 2023
By the end of 2024, the ROACE indicator increased by 1,269 percentage points compared to the level of 2023, including: an increase of 1,711 percentage points due to an increase in adjusted profit (NOPAT) by 15.24 billion tenge, a decrease of 0.443 percentage points due to an increase in average employed capital (ACE) by 60.79 billion tenge.
At the end of 2024, compared to 2023, there was an increase in EBITDA by 23.366 billion tenge, the change in the indicator was influenced by:
- changes in volumes and tariffs for regulated services by 44.011 billion tenge;
- reduction of the loss from the purchase and sale of electricity in order to compensate for hourly deviations in the actual interstate balance of the flow of electric energy by 9.069 billion tenge as a result of the introduction of a new mechanism for the operation of the electric power market;
- an increase in the cost of technological electricity consumption (losses) in the amount of 23.596 billion tenge as a result of an increase in the average purchase price of electricity;
- an increase in labor costs, including deductions of 5,606 billion tenge and other factors.
During 2024, the standards for financial stability indicators and covenants have not been violated.
Economic value generated and distributed value
The economic component of KEGOC JSC activities is of strategic importance both for the Company itself and for the country’s economy. The main focus in this area is to ensure sustainable growth and create long–term value for shareholders and investors.
The procedures for the formation and approval of a Business Plan and budgets, including a Capital Investment Plan for the implementation of investment projects (construction, reconstruction and modernization of facilities), are regulated by the Rules for the development, coordination, approval, adjustment, execution and monitoring of the execution of the Action Plan (Business Plan) and Budgets of KEGOC JSC.
The business plan is formed for a 5-year period on a rolling basis and includes consolidated data from subsidiaries. An annual budget is approved annually for the implementation of the Business Plan. The Board of Directors of KEGOC JSC monitors the execution of the Business Plan on a quarterly basis.
GRI 201-1, 201-4
Distribution of economic value, million tenge
| 2022 | 2023 | 2024 | |
|---|---|---|---|
| Total capitalization | 809,916.9 | 849,254.52 | 931,502.5 |
| own capital | 653,565.16 | 685,719.13 | 769,921.8 |
| borrowed capital | 156,351.70 | 163,535.39 | 161,580.7 |
| Funds received from the State | 0 | 0 | 0 |
| Economic value created | 227,003.95 | 263,910.63 | 337,695.7 |
| income from core business | 217,255.55 | 252,136.38 | 319,905.9 |
| financial income | 5,726.12 | 7,576.47 | 11,886.4 |
| other income | 4,022.29 | 4,197.78 | 5,903.3 |
| Distributed economic value | 217,270.65 | 253,879.87 | 322,768.5 |
| labor costs | 26,755.43 | 33,272.86 | 37,980.5 |
| expenses on taxes and fees to the state budget | 18,026.52 | 21,610.03 | 26,644.8 |
| payments to capital suppliers | 30,309.24 | 47,075.04 | 56,872.9 |
| charitable and sponsorship assistance | 0 | 0 | 1,000.0 |
| expenses for financing political parties and associations* | 0 | 0 | 0 |
| other operating expenses | 136,625.19 | 148,327.37 | 190,082.4 |
| other non-operating expenses | 5,554.26 | 3,594.57 | 10,187.9 |
| Profit after tax for the year from discontinued operations | 0 | 0 | 0 |
| Economic cost to distribute | 9,733.30 | 10,030.77 | 14,927.2 |
* Contributions or expenses to political campaigns or organizations, lobbying, trade associations, tax-exempt organizations, or other groups that influence political campaigns or government policies and legislation.
Balance analysis
Indicators of the economic balance of KEGOC JSC, million tenge
| Indicator | 2020 | 2021 | 2022 | 2023 | 2024 | 2024/2023 |
|---|---|---|---|---|---|---|
| Non-current assets | 695,193 | 1,019,820 | 873,933 | 881,415 | 960,180 | 109% |
| Current assets | 116,820 | 73,397 | 12,679 | 120,371 | 136,886 | 114% |
| Total assets | 812,013 | 1,093,217 | 986,612 | 1,001,785 | 1,097,066 | 110% |
| Capital | 502,557 | 737,137 | 653,565 | 685,719 | 769,922 | 112% |
| Long-term obligations | 239,767 | 310,397 | 273,570 | 277,540 | 289,230 | 104% |
| Short-term obligations | 69,689 | 45,684 | 59,477 | 38,526 | 37,914 | 98% |
| Total liabilities | 309,456.1 | 356,080.5 | 333,047 | 316,066 | 327,144 | 104% |
| Total equity and liabilities | 812,013 | 1,093,217 | 986,612 | 1,001,785 | 1,097,066 | 110% |
As of December 31, 2024, the Company’s assets amounted to KZT 1,097,066.1 million, an increase of 10% compared to 2023.
Long-term assets account for 87.5% of the balance sheet structure, which is mostly represented by fixed assets. By the end of 2024, long-term assets showed an increase of 8.9% or 78,765.8 million tenge and amounted to 960,180.3 million tenge.
Short-term assets account for 12.5% of the balance sheet. In 2024, they increased by 13.7% (or by KZT 16,515.3 million) and amounted to KZT 136,885.8 million at the end of the year. The increase was driven by an increase in other financial assets as a result of coupon bonds of Samruk-Kazyna JSC, as well as cash and cash equivalents at the end of the period.
Capital at the end of 2024 amounts to KZT 769,921.8 million, an increase of 12.3% by 2023, or KZT 84,202.7 million, mainly due to the revaluation of fixed assets in December 2024 and the growth of retained earnings. The share of capital in the balance sheet structure was 70.2%.
Liabilities for the year amounted to KZT 327,144.3 million, an increase of 3.5% or KZT 11,078.4 million compared to 2023. 88.4% of liabilities are long–term, 11.6% are short-term. The change was due to a decrease in loan obligations due to the planned repayment of the loan from the International Bank for Reconstruction and Development, an increase in deferred income tax liability by KZT 14,057.5 million as a result of the revaluation of fixed assets in December 2024.
Stable financial performance allows the Company to fulfill its obligations to its main stakeholders on time and in full:
- to pay salaries to employees and provide social support;
- on payment of dividends to shareholders;
- to implement investment projects and improve the quality and reliability of the NPG operation;
- on timely settlements with suppliers;
- on payment of taxes.
Profitability indicators of KEGOC JSC, billion tenge
Indicators for the implementation of Goal 3
| 2019 | 2020 | 2021 | 2022 | 2023 | 2024 | |
|---|---|---|---|---|---|---|
| Name of the KPI | Actual | Actual | Actual | Actual | Actual | Actual |
| TSR (total shareholder return), % | The indicator was determined in December 2021 | -10.7 | 3.44 | 13.96 | ||
| EBITDA, billion tenge | 88.5 | 108.4 | 93.9 | 102.5 | 108.1 | 131.5 |
The actual value of the TSR indicator was affected by an increase in the Company’s share price in 2024 to 1,527 tenge per share compared to 1,482 tenge per share in the same period last year, while the Company paid 161.9 tenge of dividends per share at the end of the year. EBITDA growth is mainly influenced by changes in volumes and tariffs for regulated services, as well as changes in the purchase price of electricity from a Single Buyer.